Zego: The smarter insurance
Back in 2019, Zego committed to develop an app that would help their
customers save money by better driving. When I joined in mid 2021,
however, that promise fell short of reality as the app resembled a
minimum viable product, where the aesthetic had a bigger role than
the actual functionality.
The journey
In less than 6 months, together with the amazing Appcelerate team composed of 1 Product manager, 1 UX Researcher, 4 engineers (iOS, Android, Q&A, back-end) and myself as Lead Product designer, we managed to fulfil our company’s ambitious goal and deliver the new Sense App. A product built with sustainable technology and best in class UX, bringing value to our customers as well as flexibility to scale our product and business.
The outcome
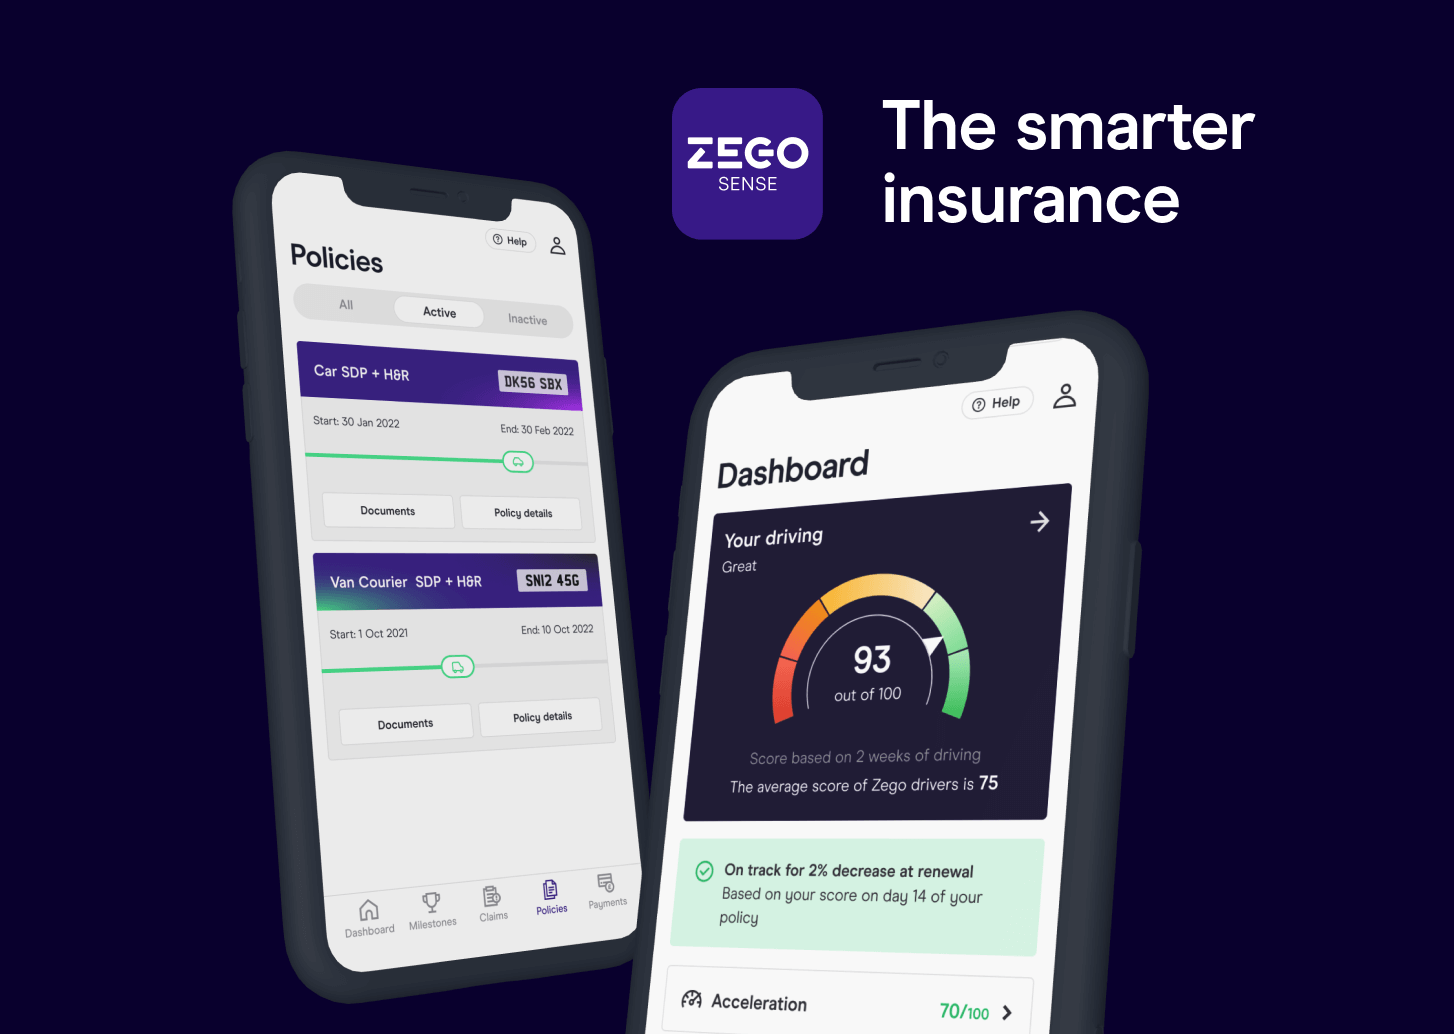
Today, the Zego Sense app collects telematics data from
the phone sensors, and provides daily insights and tips
for the driving, as well as an overall Driving Score gauge
which drivers can then use to effectively being in charge
and improve their driving performances, which ultimately
translates to fairer pricing at renewal time. The App also
provides customers a simple and effective way to manage
and renew their policies.
In this project I summarised the process of shaping the
dashboard: the core of the app.
Insights
We started our research by launching surveys and user testing
prototypes to gain customer insights focused on how to display
their driving data collected since the release of our MVP back
in 2020.
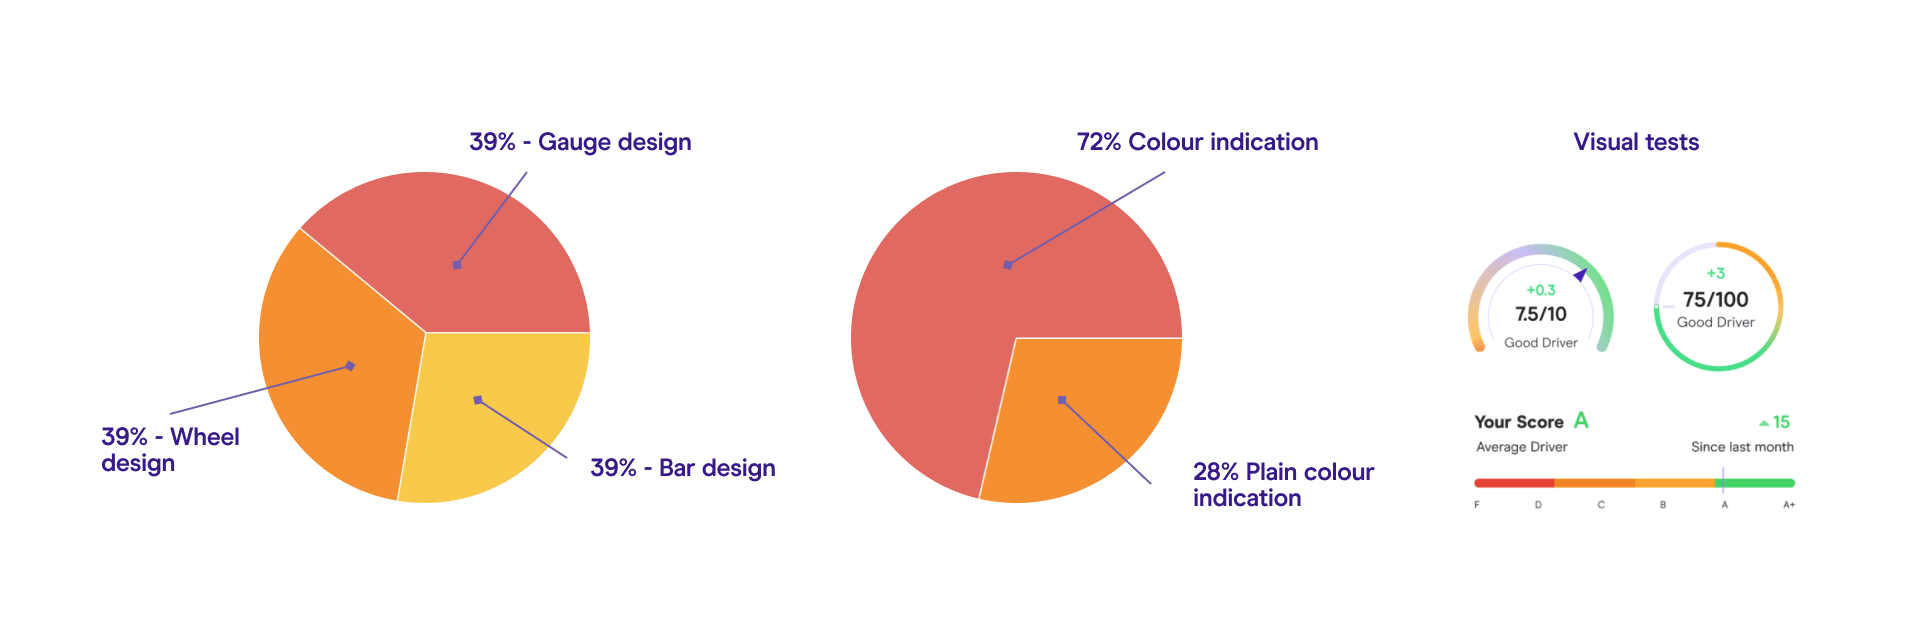
Visualising data
Users felt more connected with a gauge visual indicator for their score as it resembled a vehicle speedometer. Using the Red, Green and Amber colours gave them an instant understanding of their performances.
Transparency
Users expressed the need of having more information and transparency about how Zego collects their data and how the sensors work.
Numeric indications
Score number: /100 was received better than /10, as it was perceived as being more granular and less approximative
Comms
We observed users’ interest in receiving comms about their score, especially regarding a recent change, and how it impacts their policy
The functionality
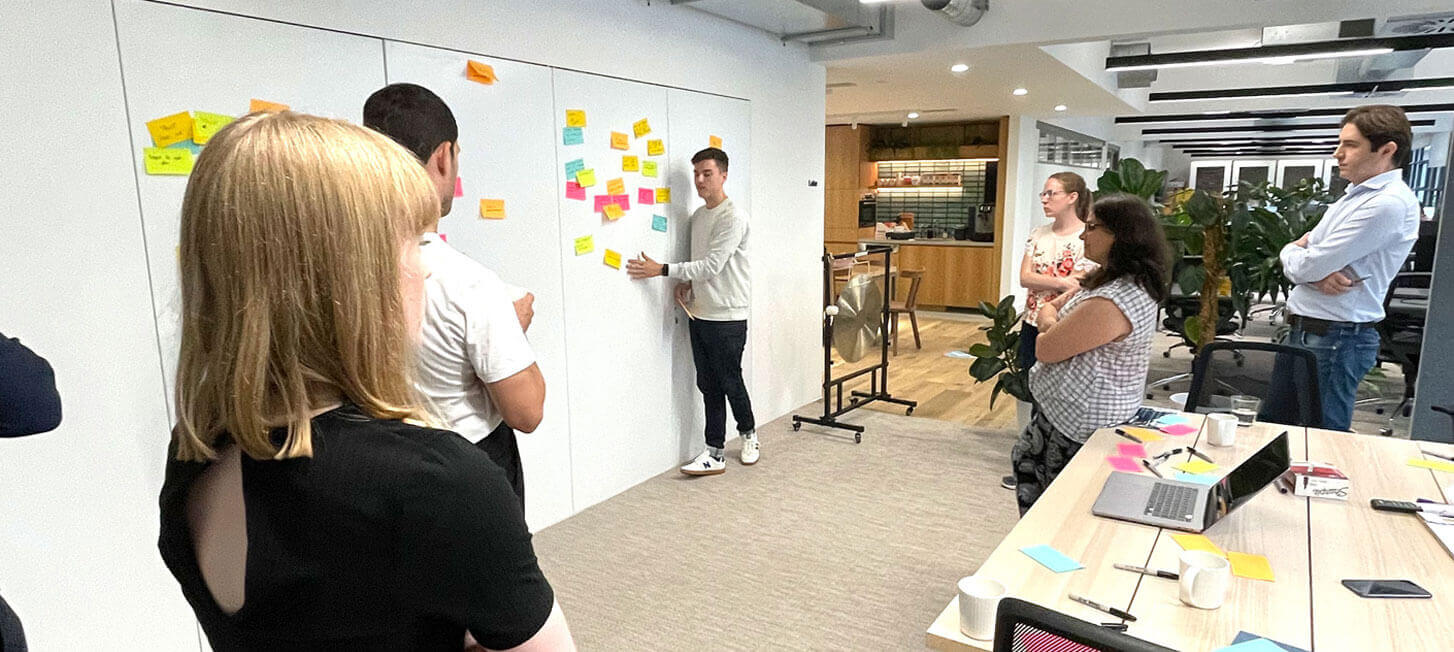
After conducting many user interviews, insights and prototype testings, we run multiple workshop sessions within the team to establish the core functionalities of the app dashboard:
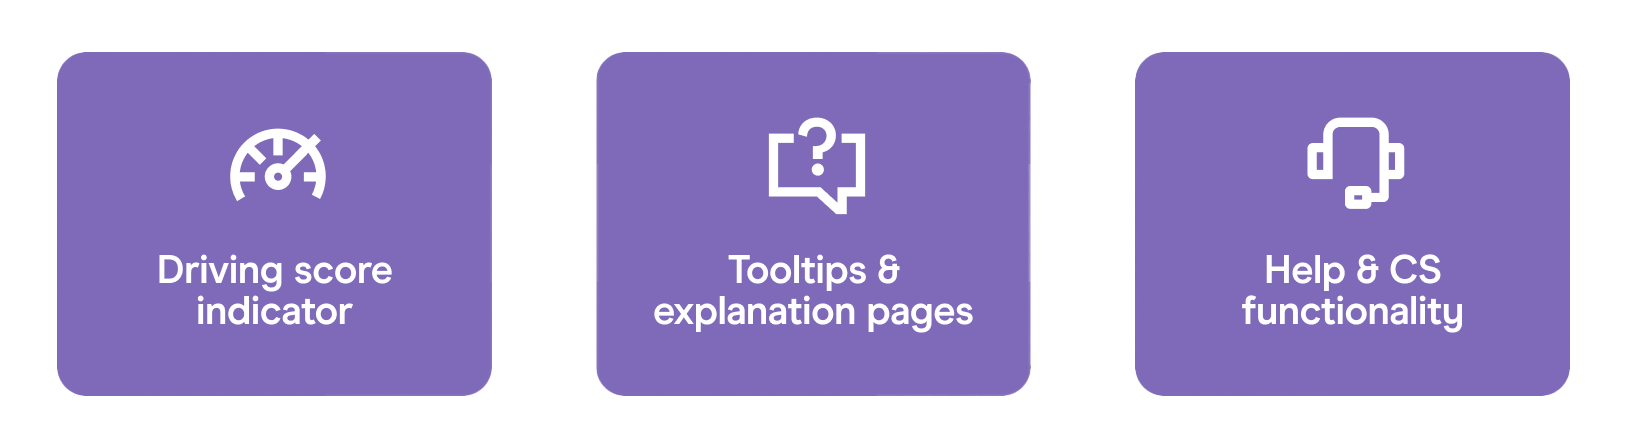
Driver score gauge
A simple visual indicator with 5 colour buckets to reflect user’s driving behaviour, and how it influences the pricing at policy renewal
Explanation pages
Offering tooltips to better understand how Zego collects the data, along with tips to better drive to ultimately save money at renewal.
Help & Coming soon pages
Help pages to engage with the users, guide them through our products and offer Customer Support experience. Also showing a list of the work in progress to showcase what’s coming next in the app.
Wireframes & design
The project involved several wireframing iterations and prototypes. Below an example of a quick wireframing session I worked on Miro. It showcases the final structure of the Zego Sense Dashboard and notes to identify scenarios and tech functionalities:
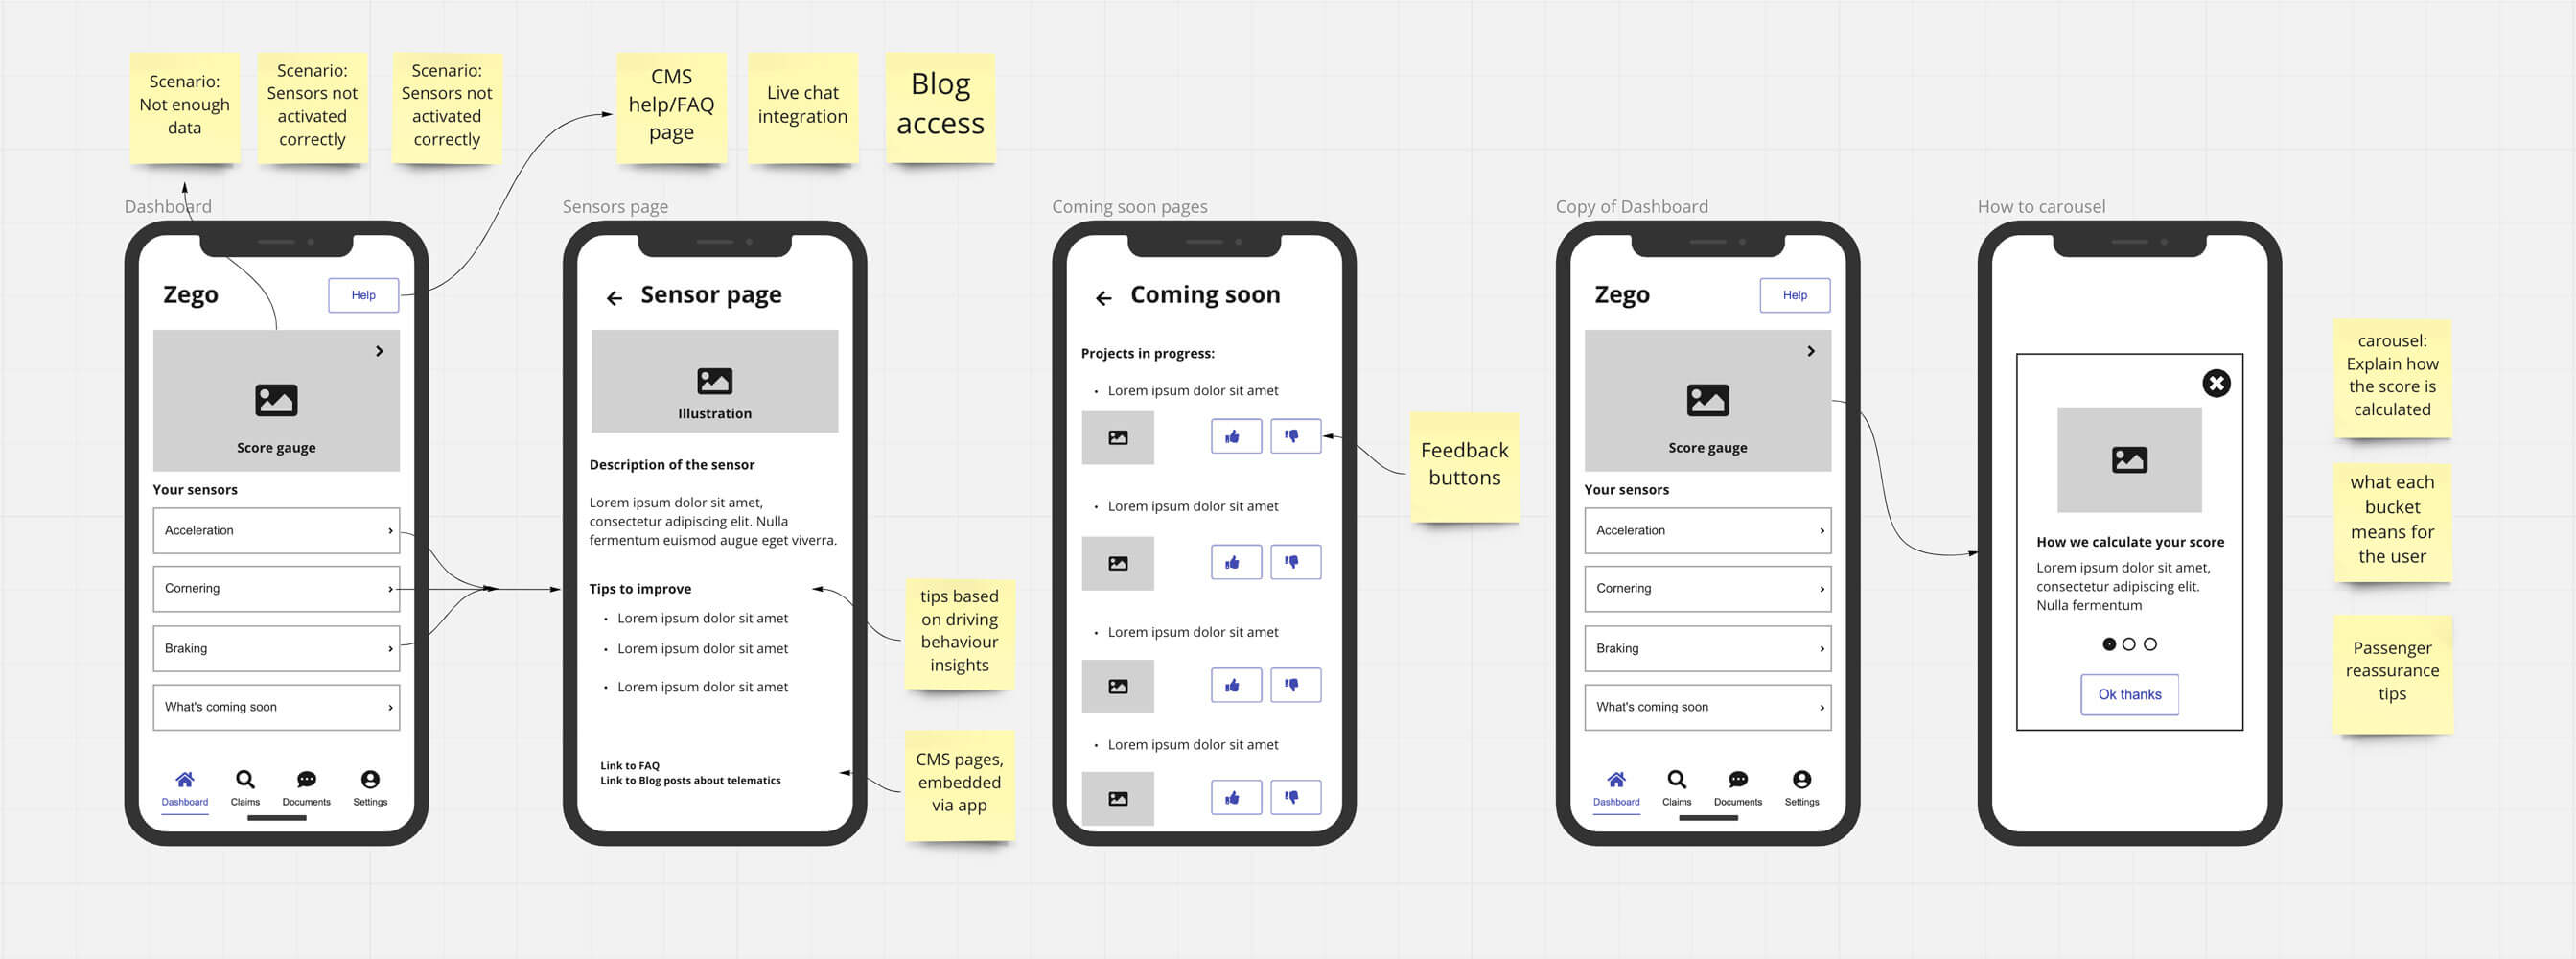
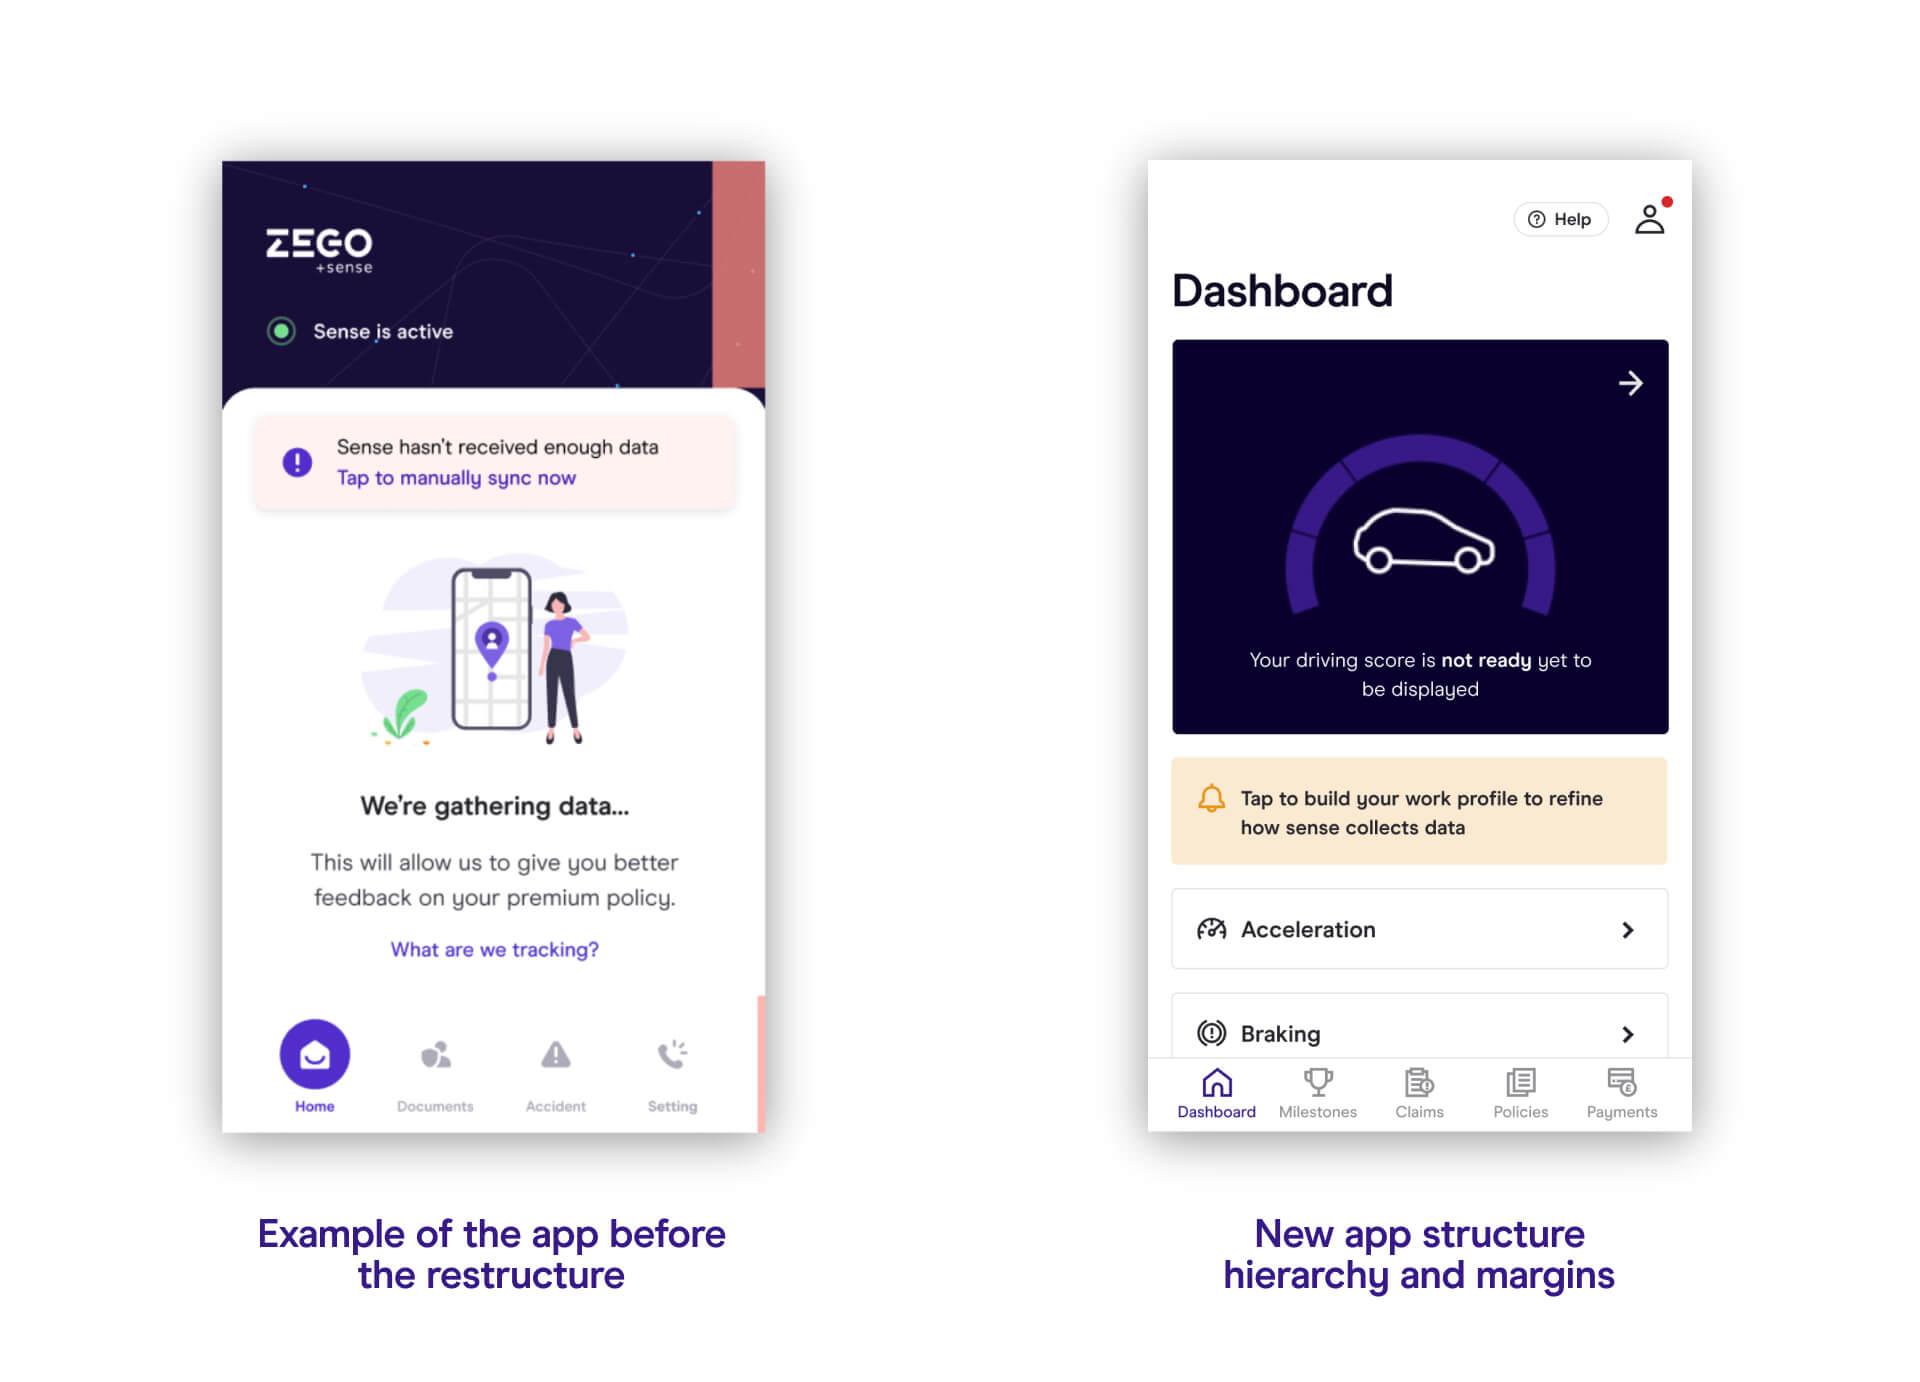
App structure
Working sustainably is a value that I love to bring in my day to day work. I took advantage of the structural changes to propose a complete redesign of the app architecture: a simple, scalable layout that users can understand at a glance, using native-friendly components which allow us to speed up the development cycles and provide a full optimisation for all the different screen sizes and devices used by our users.
Animations
For this project I also took care of the motion design & animations. Both animations have been created with Adobe After Effect and exported in JSON-based format that enables quick implementation without any further coding.
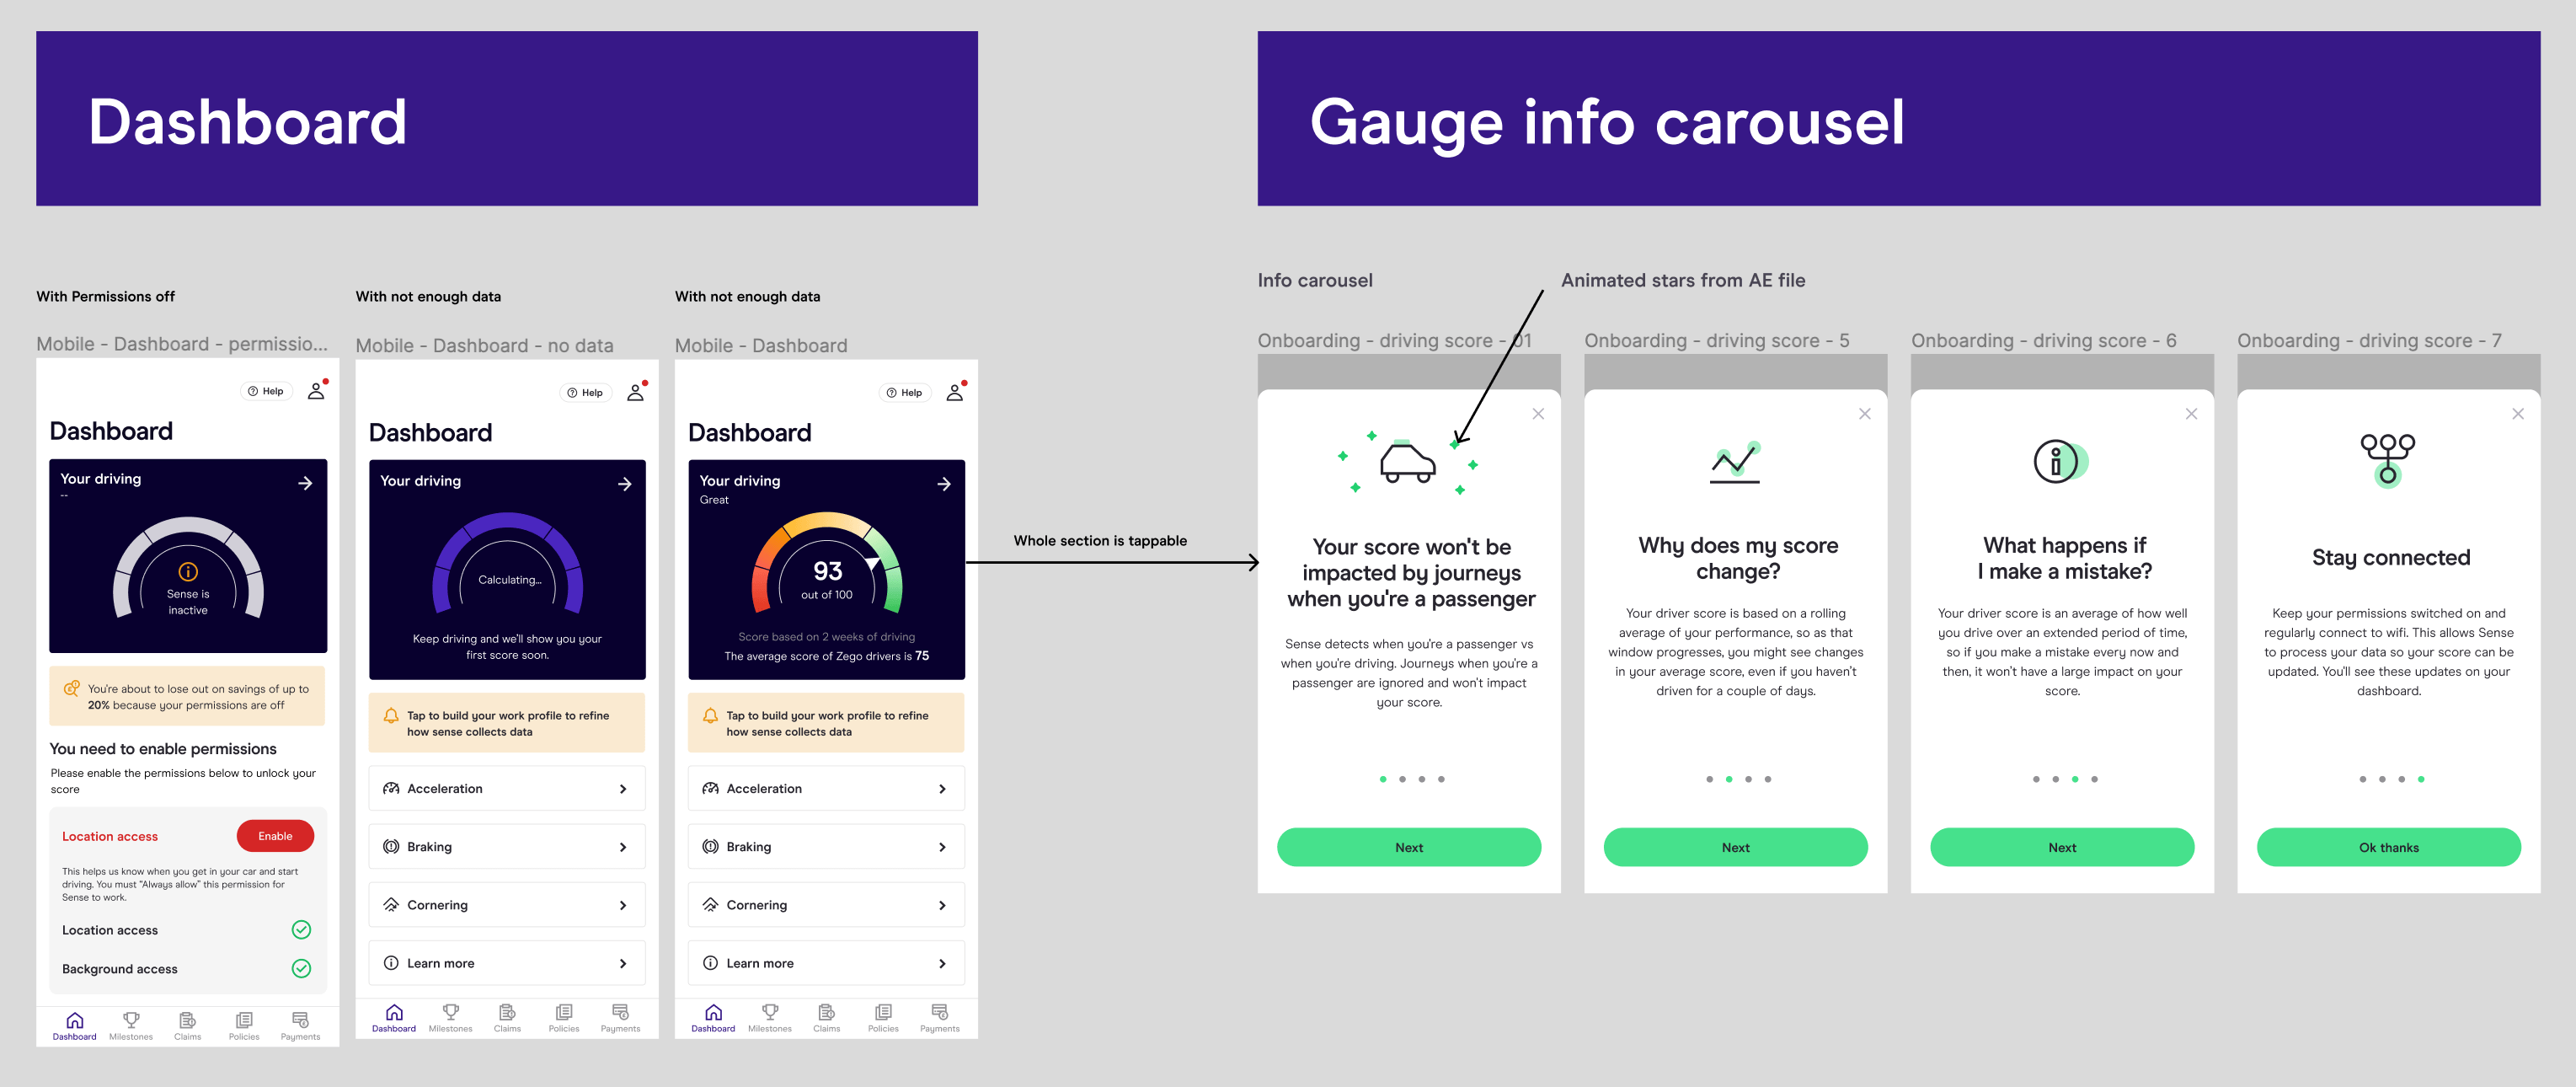
Final design
Below the final design fully tested and validated. The first image shows the Dashboard scenarios screens and the gauge info carousel flow, with examples of how I provide handoff notes for the engineers. To shape my designs I use Figma and After effects for the animations.
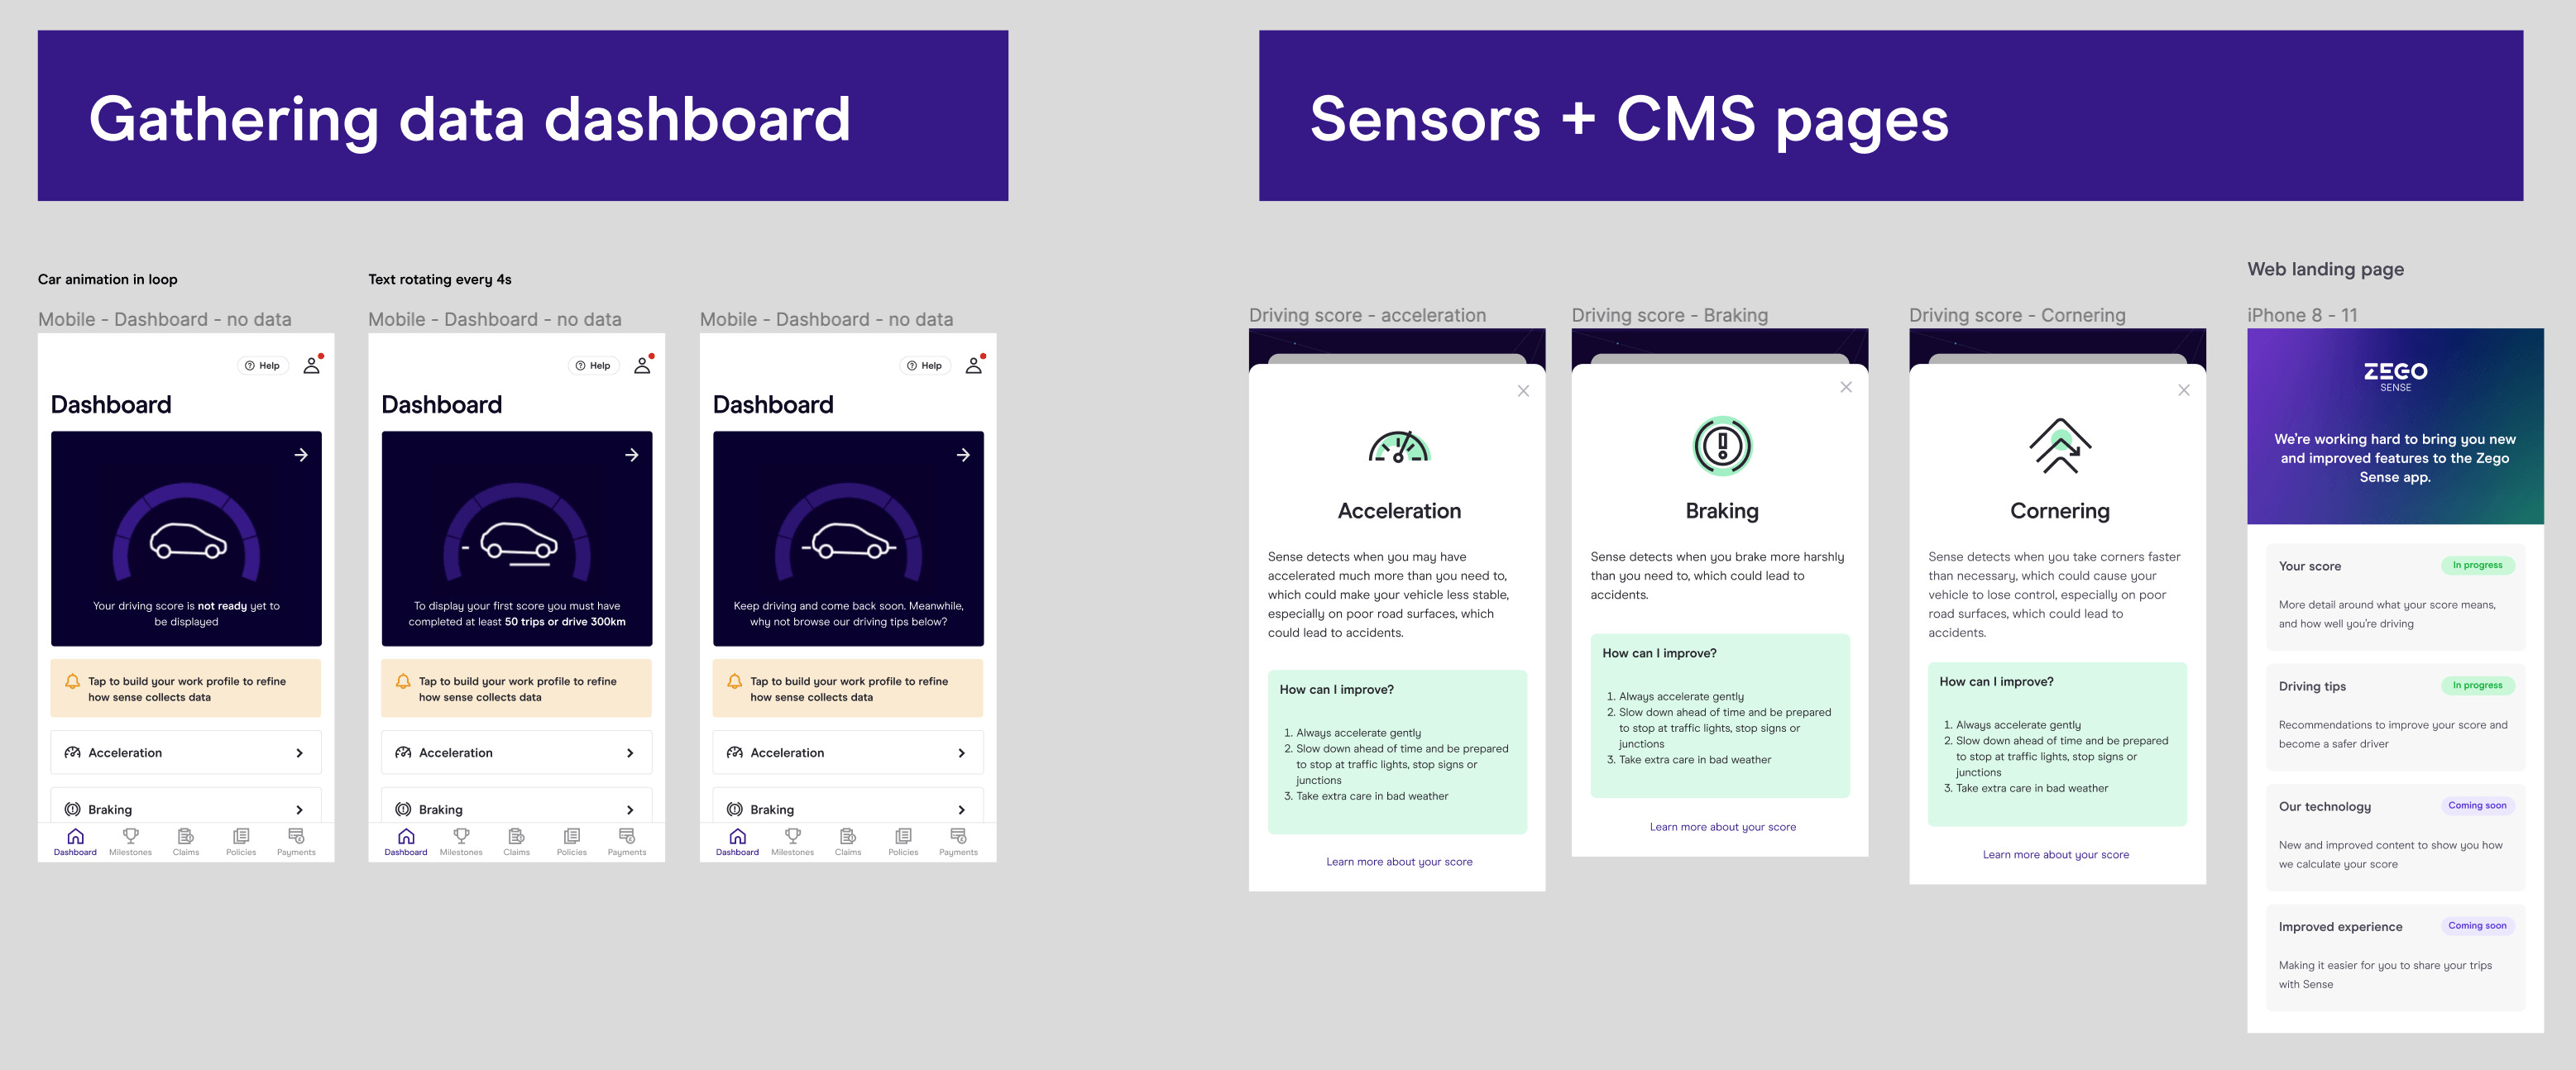
The image below shows the animation handoff of the gathering data dahsboard and an exploratory of the sensor pages and CMS.
The outcome
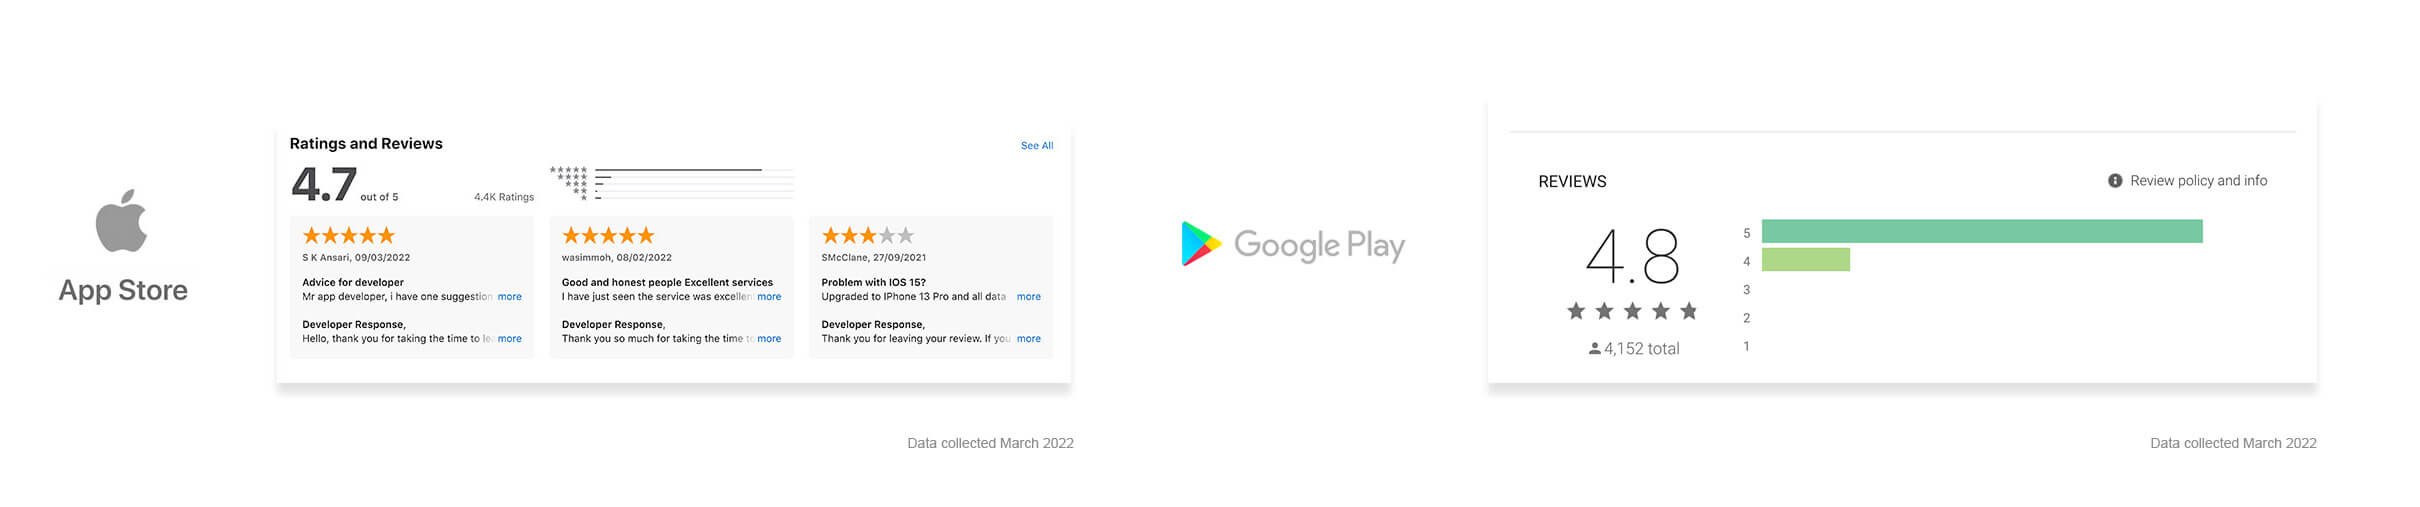
Since the first launch back in June 2021, we started seeing huge impacts on our conversion rate metrics and many business OKR in policy purchases, data gathering and in-app engagement.
This was
possible by releasing new versions of the app in a bi-weekly cadence
introducing more features, bugs fixes and a constant improvement of
our comms capabilities and usability that ultimately reinforced and
gained users more trust towards our new Zego Sense products. A good
example can be found in the app reviews of both platforms: iOS
ratings went up from 2.8 to 4.7 stars, and 4.8 on Android.